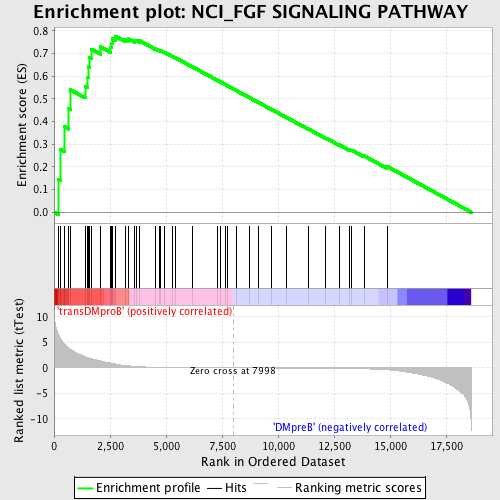
Profile of the Running ES Score & Positions of GeneSet Members on the Rank Ordered List
| Dataset | Set_04_transDMproB_versus_DMpreB.phenotype_transDMproB_versus_DMpreB.cls #transDMproB_versus_DMpreB.phenotype_transDMproB_versus_DMpreB.cls #transDMproB_versus_DMpreB_repos |
| Phenotype | phenotype_transDMproB_versus_DMpreB.cls#transDMproB_versus_DMpreB_repos |
| Upregulated in class | transDMproB |
| GeneSet | NCI_FGF SIGNALING PATHWAY |
| Enrichment Score (ES) | 0.776855 |
| Normalized Enrichment Score (NES) | 1.752789 |
| Nominal p-value | 0.0 |
| FDR q-value | 0.02370172 |
| FWER p-Value | 0.037 |
| PROBE | DESCRIPTION (from dataset) | GENE SYMBOL | GENE_TITLE | RANK IN GENE LIST | RANK METRIC SCORE | RUNNING ES | CORE ENRICHMENT | |
|---|---|---|---|---|---|---|---|---|
| 1 | STAT1 | 3936 5524 | 190 | 6.574 | 0.1451 | Yes | ||
| 2 | GAB1 | 18828 | 276 | 5.806 | 0.2777 | Yes | ||
| 3 | PDPK1 | 23097 | 458 | 4.644 | 0.3777 | Yes | ||
| 4 | PAK4 | 17909 | 660 | 3.824 | 0.4572 | Yes | ||
| 5 | MAPK1 | 1642 11167 | 721 | 3.643 | 0.5401 | Yes | ||
| 6 | PMF1 | 12452 | 1382 | 2.177 | 0.5560 | Yes | ||
| 7 | PTK2B | 21776 | 1509 | 1.984 | 0.5961 | Yes | ||
| 8 | GRB2 | 20149 | 1534 | 1.943 | 0.6407 | Yes | ||
| 9 | SPP1 | 5501 | 1594 | 1.869 | 0.6817 | Yes | ||
| 10 | JUN | 15832 | 1670 | 1.759 | 0.7193 | Yes | ||
| 11 | MMP9 | 14732 | 2073 | 1.336 | 0.7292 | Yes | ||
| 12 | MAPK3 | 6458 11170 | 2529 | 0.941 | 0.7269 | Yes | ||
| 13 | PLAUR | 18351 | 2573 | 0.900 | 0.7459 | Yes | ||
| 14 | RPS6KA1 | 15725 | 2592 | 0.884 | 0.7658 | Yes | ||
| 15 | FOS | 21202 | 2723 | 0.766 | 0.7769 | Yes | ||
| 16 | FGFR2 | 1917 4722 1119 | 3175 | 0.460 | 0.7634 | No | ||
| 17 | CTTN | 8817 4575 1035 8818 | 3329 | 0.387 | 0.7643 | No | ||
| 18 | PLAU | 22084 | 3592 | 0.286 | 0.7570 | No | ||
| 19 | CAMK2A | 2024 23541 1980 | 3683 | 0.261 | 0.7583 | No | ||
| 20 | SSH1 | 10540 | 3828 | 0.224 | 0.7558 | No | ||
| 21 | NCAM1 | 5149 | 4518 | 0.105 | 0.7212 | No | ||
| 22 | SOS1 | 5476 | 4708 | 0.086 | 0.7131 | No | ||
| 23 | CDH1 | 18479 | 4756 | 0.082 | 0.7125 | No | ||
| 24 | PIK3R1 | 3170 | 4927 | 0.072 | 0.7050 | No | ||
| 25 | HGF | 16916 | 5269 | 0.056 | 0.6880 | No | ||
| 26 | IL17RD | 22069 | 5424 | 0.049 | 0.6808 | No | ||
| 27 | FGF1 | 1994 23447 | 6173 | 0.029 | 0.6413 | No | ||
| 28 | SPRY2 | 21725 | 7274 | 0.010 | 0.5823 | No | ||
| 29 | PLCG1 | 14753 | 7414 | 0.008 | 0.5750 | No | ||
| 30 | RUNX2 | 4480 8700 | 7650 | 0.004 | 0.5624 | No | ||
| 31 | PIK3CA | 9562 | 7760 | 0.003 | 0.5566 | No | ||
| 32 | FGFR1 | 3789 8968 | 8129 | -0.002 | 0.5368 | No | ||
| 33 | STAT5B | 20222 | 8729 | -0.010 | 0.5048 | No | ||
| 34 | SHC1 | 9813 9812 5430 | 9137 | -0.016 | 0.4833 | No | ||
| 35 | PTPN11 | 5326 16391 9660 | 9715 | -0.024 | 0.4528 | No | ||
| 36 | SDC2 | 9134 | 10386 | -0.035 | 0.4176 | No | ||
| 37 | SRC | 5507 | 11343 | -0.054 | 0.3674 | No | ||
| 38 | MET | 17520 | 12133 | -0.077 | 0.3267 | No | ||
| 39 | FGFR4 | 3226 | 12719 | -0.103 | 0.2976 | No | ||
| 40 | AKT1 | 8568 | 13190 | -0.131 | 0.2754 | No | ||
| 41 | CDH2 | 1963 8727 8726 4508 | 13286 | -0.138 | 0.2736 | No | ||
| 42 | CBL | 19154 | 13840 | -0.189 | 0.2483 | No | ||
| 43 | FGF23 | 17275 | 14861 | -0.373 | 0.2022 | No |

